They say that sector movement accounts for about 50% of a stock’s increase or decrease. Thus, in addition to performing fundamental and technical analysis on a stock one should also take a look at the overall sector. Usually, this task is accomplished by looking at an index of stocks that are in the same business. In addition to sectors and industries some indices also consider the size of the stocks (the Russell 2000 is a small cap index whereas S&P 500 is comprised of large cap stocks).
The two most well known biotech indices are BTK (Amex Bioteck Index) and NBI ( Nasdaq Biotech Index). In addition to these two I also look at BBH, Merrill lynch biotech HOLDERS which is a tradable basket of biotech stocks. Today, I looked at each one of their performances year-to-date and I was quite amazed at the differences between the three.
The following link shows a Year-to-date chart of the above mentioned indices. Overlay chart
Although the direction of the moves of each index tracks with others, the magnitude and recent divergence has made me want to look more closely at them. Since January, BTK is down about 3% while NBI and BBH are down 6% and 13% respectively. Furthermore, in the last week BTK and NBI have been moving up while BBH has been trending downward. Personally, I have been using the BTK to assess the sector movement of my biotech stocks and after seeing this difference, I was not sure if I was using the correct index.
BTK
The BTK (Amex Biotechnology Index) is an equally weighted index of the following stocks:
AFFX, AMGN, BIIB, CELG, CEPH, CRA, DNA, GENZ, GILD, HGSI, ICOS, IMCL, ITMN, IVGN, MEDI, MLNM, MYOG, NKTR, PDLI, VRTX
They all have about a 5% weighing which gets reset every quarter. This is a drawback as it puts equal weight in smaller companies and a few bad performers could have a large impact on the performance of the index. Another drawback of this index is its narrow focus. There are only 20 companies represented (There where 17 in 2004). This list also includes companies that are not drug companies. These include AFFX, CRA, IVGN which sell products or services to the biotech industry. They sell either instruments, technology or raw materials and tend to have lower profit margins, lower growth potential as well as significant amount of competition. IVGN (Invitrogen) for example has been a flat stock since 2000. In my opinion these companies should not be placed in an index of biotech drug manufacturers. Instead, I would like to include ALKS, AMLN, SEPR, CBST, OSIP, RNAI, ALNY or any other biotech company that is trying to market pharmaceutical products which are usually patent protected and have very high profit margins and outstanding market potential.
I do like the fact that the BTK is not weighted by the size of the companies and not dominated by DNA and AMGN.
NBI
The NASDAQ Biotechnology Index (NBI) contains about 170 Nasdaq listed biotechnology and pharmaceutical companies and is calculated using a modified capitalization-weighted methodology. The capitalization weighing however could be counteracted by the number of companies present in this index. This link shows the companies that make up the NBI.
BBH (click on the image to see a list of the stocks in BBH)
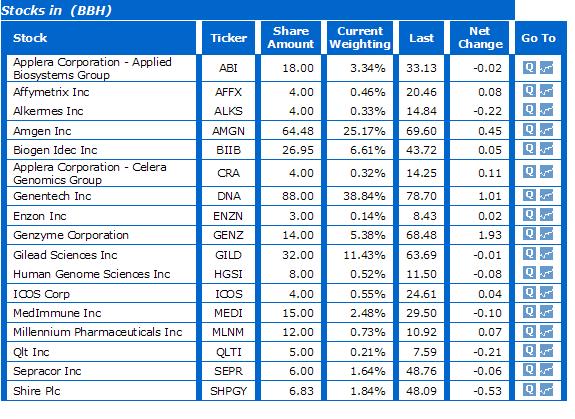 The Merrill Lynch Bitoech HOLDERS is a basket of stocks. When you buy a share of BBH, you own a piece of each of the companies. As you can see from this table, this basket is heavily weighted to the large cap compankies such as DNA, AMGN, GILD and GENZ. Interestingly, MLNM (which I think is one of the worse companies in this sector and I will be sure to write a blog entry about it) has a relatively high share. No sign of VRTX, AMLN, PDLI,CEPH or RNAI. This is probably the weakest of the three indices because it has a limited number of company and it is biased towards large cap stocks.
Bottom Line
After analyzing the three indices, it is my opinion that NBI is the most relevant index unless you own DNA or AMGN then I would use the BBH. BTK has an advantage because it is equal weighted but it does not have enough of relevant biotech stocks to make it a good index. You could make your own basket of relevant equally weighted 50 biotech stocks (all in the same growth stage) that would be better than any of the above indices but who has time for that?
If you want to track the performance of biotech companies that are not large cap such asDNA, AMGN, GENZ, BIIB, you can use the difference between NBI and the BTK. The comparison between BBH and BTK could be used to determine the effect of weighting. BBH, the weighted index of 17 stocks is down 13% YTD while BTK the equally weighted index of similar 20 stocks is down only 3% YTD.
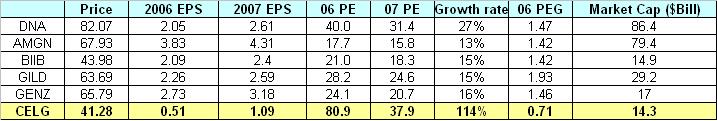
To me this suggest that the large cap biotechs have been hurting the most in this sector. In fact if you look at my CELG article , you can see a table that shows relatively low PE and relatively low expected growth rates for the large cap biotechs. The 2007PEG(PE07/growth ratio) for these stocks is between 1.42-1.93, which makes them fairly valued. Historically, these companies have had higher PEs and PEGs and as sector rotation puts Bitoech back in favor, I expect these stock prices and PEs to increase. Of course, this assumes no changes in the companies’ businesses going forward. As new products are launched or mergers occur, these companies could take off.
JMHO